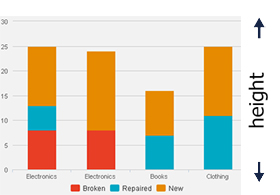
The next steps are only needed if you want to know how the remaining parameters worksIn the Height parameter you can define the vertical size of the chart in pixels (300 by default). The horizontal size of the chart is the parent’s width.
The position where the legend is displayed on the chart ('Bottom' by default). The legend is hidden if no series name is set in any data point.
This parameter only change X-axis area. Action XAxisFormat_Init helps to create and initialize this parameter. For example try to replicate the next image in your application to see the result.
Following the same behavior but with a different action name (YAxisFormat_Init) you can achieve the same results but in the Y-axis area.
This is regarding the formatting options for the chart. The action ChartFormat_Init helps to create and initialize this parameter.
You can turn on the clicking action on plotted values. This is very helpful to apply a drilldown effect to the chart.